UI Prototype, Better Abstractions, Neovim
1/14/23
I have finished hooking up my tRPC routes, refactoring my old Python code, and implementing a rough UI. The process has been smooth. Type safety on the client and server side has been wonderful to work with — Pydantic and FastAPI guard the Python edge, tRPC the React/Typescript side. So long as their data shapes agree, I am safe. Granted, GraphQL could ensure full end-end type safety, but it would be a heavy dependency. For now, typing the edges reduces the error-prone surface with minimal effort.
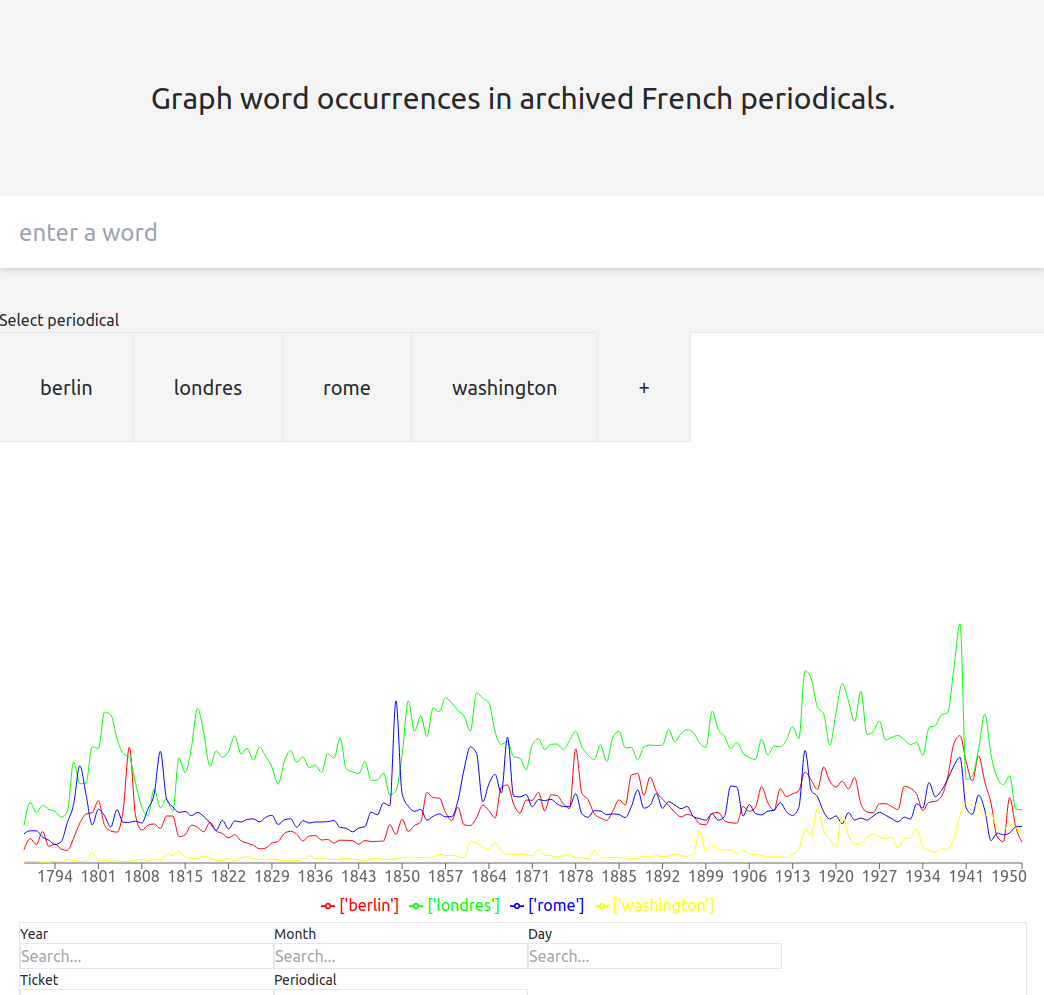
This past week was very exciting. The new Gallica Grapher should allow more spontaneity when graphing — no need to begin a new search from the top, just enter a term and add it to the graph. Wonderful! There are many bugs left to work out, of course. The UI is not very pleasant to behold. But the technical foundation is now far more solid with Typescript on the front end, and it should be much easier to add new features.
I owe my rapid progress to effective abstractions, namely, React Query and Recharts, a React charting library. I spent a half-day attempting to make a beautiful chart with straight d3 in my React code. It was a tiresome experience. State was hard to synchronize between React and d3, in part, I suspect, because both manipulate the DOM. After a few hours of struggling, I realized I had wandered too far from the well-traveled road of React devs who want to chart data. Very few React devs, I suspect, write a custom d3 solution for a simple chart. After some Google searching, I discovered Recharts, a beautiful component-based abstraction on top of d3. Creating a multi-series chart is as simple as mapping the series into Line components inside a LineChart. Music to my React-pilled ears. I then found visx, an Airbnb visualization library also built on top of d3. But, seeing how Recharts is working, I will stick with that.
React-Query made fetching a batch of tickets straightforward, and handles caching for me. Setting up a polling query for progress was equally straightforward. I have been following the creator’s advice of not storing any fetched data in state. It is a near-magical solution, at times. Deleting a ticket seamlessly deletes a series from the graph. The wonders of a UI framework. I know many people critique React for its performance, but my oh my, I will always love React for first empowering me to create web applications.
Finally, I have been spending a lot of time on dev Twitch and dev Twitter. The NeoVim community is loud and exciting, and I decided to give it a try. I recently switched to Linux, PopOS distro, on my laptop, and set up NeoVim. I have enjoyed working with it so far. I use Vim motions in Pycharm and VS Code, but am no expert at Vim script and customization. We will see if Neovim, and the Lua customization it provides, will enhance the experience. At the very least, it is a lovely, passionate community. And community makes many things worth it!
That is all for this week. Next week will be heavy on UI improvements. I would also like to configure my Next server-side rendering set up. I plan to have an initial example chart show on the home page, and that data can be cached server-side. I think getStaticProps will do the trick. Eventually, I would like to migrate the Python backend of the Gallica Grapher to Go. Partly because I think Go is better for network-heavy apps. Partly because I want to become more familiar with it. Partly because it will help me get a job. Three noble reasons to switch to Go!